Deploying an OpenTelemetry-Native LGTM Stack on Kubernetes
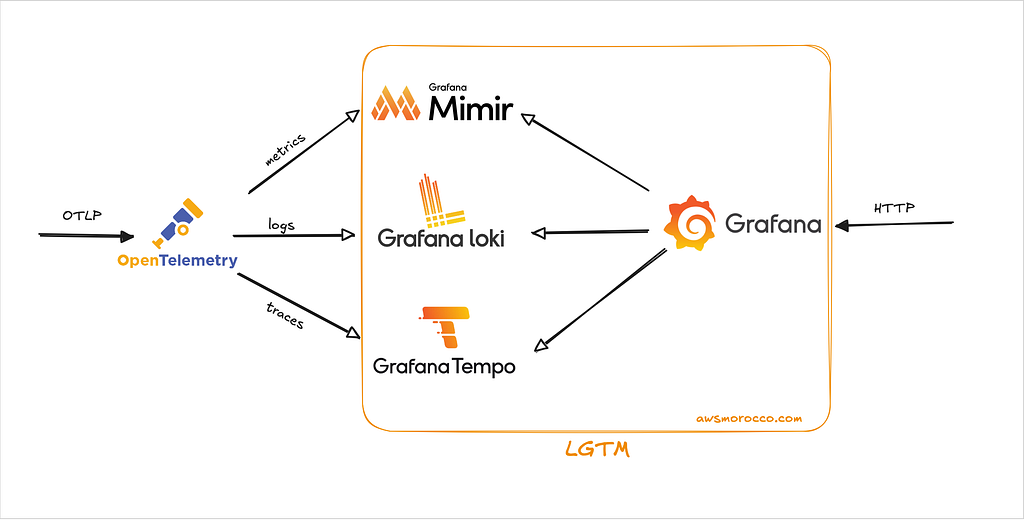
In my previous article on Observability 2.0, I talked about how ClickStack and unified platforms solve the fragmented three-pillar problem by storing everything in ClickHouse. That’s the ideal end state — but what if you’re not ready to rip and replace your entire stack today? This Helm chart is the pragmatic answer. It’s still three separate backends under the hood (Loki, Tempo, Mimir), but thanks to OpenTelemetry’s OTLP protocol, it feels like one unified system. Your apps emit OTLP, hit a single gateway, and that gateway routes everything to the right storage. You get centralized ingestion, Grafana pre-wired for correlation, and zero vendor lock-in. ...