Open source, highly available Prometheus setup with long term storage capabilities.
Prometheus has clearly established itself as the benchmark solution for metrics collection and alerting in cloud-native environments. Its pull-based architecture, powerful query language (PromQL) and extensive ecosystem have made it an essential tool for DevOps and SRE teams. However, as organizations scale their Kubernetes deployments across multiple clusters and regions, they often hit limits with Prometheus. That’s where Thanos comes in, offering a set of components that extend Prometheus’ capabilities and address its scalability challenges.
In a previous article, “Unlimited metrics storage at low cost with Thanos:Monitor All Your K8s Clusters Anywhere and More”, we presented Thanos as a powerful solution for scaling Prometheus in multi-cloud Kubernetes environments. This article builds on that, offering a deeper dive into Thanos, its architecture and how it addresses the specific limitations of Prometheus at scale.
Prometheus: Challenges at Scale
Before getting into Thanos, it’s important to understand the limitations Prometheus faces in large-scale deployments:
1 — Limited Storage Retention
Prometheus uses a local storage model, writing time series data to disk. While efficient for recent data, this approach poses challenges for long-term retention:
- Storage capacity is limited by the node’s disk space (or the disk mounted on the node).
- Scaling storage often requires vertical scaling of the Prometheus server.
- Retention periods are typically limited to weeks rather than months or years.
2 — Limited Query Performance
As the volume of metrics grows, query performance can degrade significantly:
- Large queries can consume substantial CPU and memory resources
- Real-time monitoring becomes challenging with increased query latency
- Historical data analysis becomes time-consuming and resource-intensive
3 — High Availability Concerns
Standalone Prometheus instances represent a single point of failure:
- Data loss can occur if a Prometheus instance fails
- Setting up manual high availability is complex and often error-prone
- Achieving consistent views across replicated Prometheus instances can be hard and challenging.
4 — Multi-Cluster and Global View Limitations
In distributed environments, getting a unified view across multiple Prometheus instances is difficult:
- No built-in way to query across multiple Prometheus servers
- Maintaining a global view requires custom solutions or external tools
Federation, whileavailable, has significant limitations:
- It doesn’t solve long-term storage issues
- It can increase query latency and resource usage
- It requires careful configuration to avoid data duplication
- Scaling federation setups can become complex and hard to manage
These limitations of Prometheus, including its federation capabilities, highlight the need for a more robust solution when dealing with large-scale, multi-cluster environments. This is where Thanos comes in, offering a comprehensive approach to address these challenges.
Thanos: A Deep Dive
Thanos is an open-source project (under the cncf umbrella)that extends the capabilities of Prometheus, taking into account its limitations while maintaining compatibility with the Prometheus ecosystem.
1 — Introducing Thanos
Thanos consists of a set of components that work together to provide :
- Unlimited storage of metrics using object storage systems
- A global view of queries across multiple Prometheus instances
- Down-sampling and compaction for efficient long-term data storage
- High availability and de-duplication of metrics.
Thanos components can be used independently or together, adapting to simple or complex use cases.
2 — Thanos architecture
Let’s take a look at the main components of Thanos:
2.1 — The Thanos sidecar:
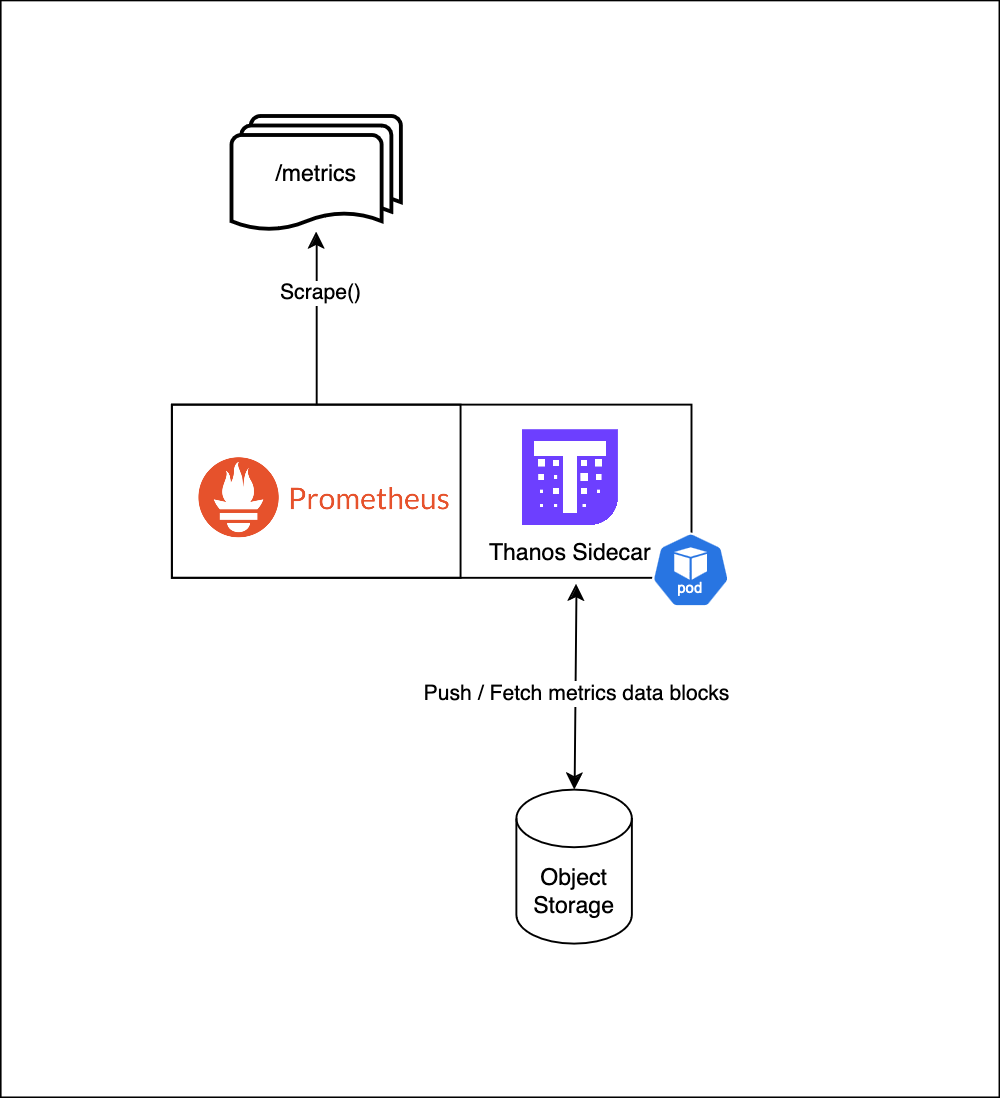
Role :
- Runs alongside Prometheus as a sidecar, retrieves metrics, creates TSDB blocks and uploads them to object storage.
Key features:
- Runs alongside Prometheus instances.
- Uploads TSDB blocks to object storage (e.g., S3, GCS).
- Enables long-term storage without affecting Prometheus performance.
2.2 — The Thanos Receiver:
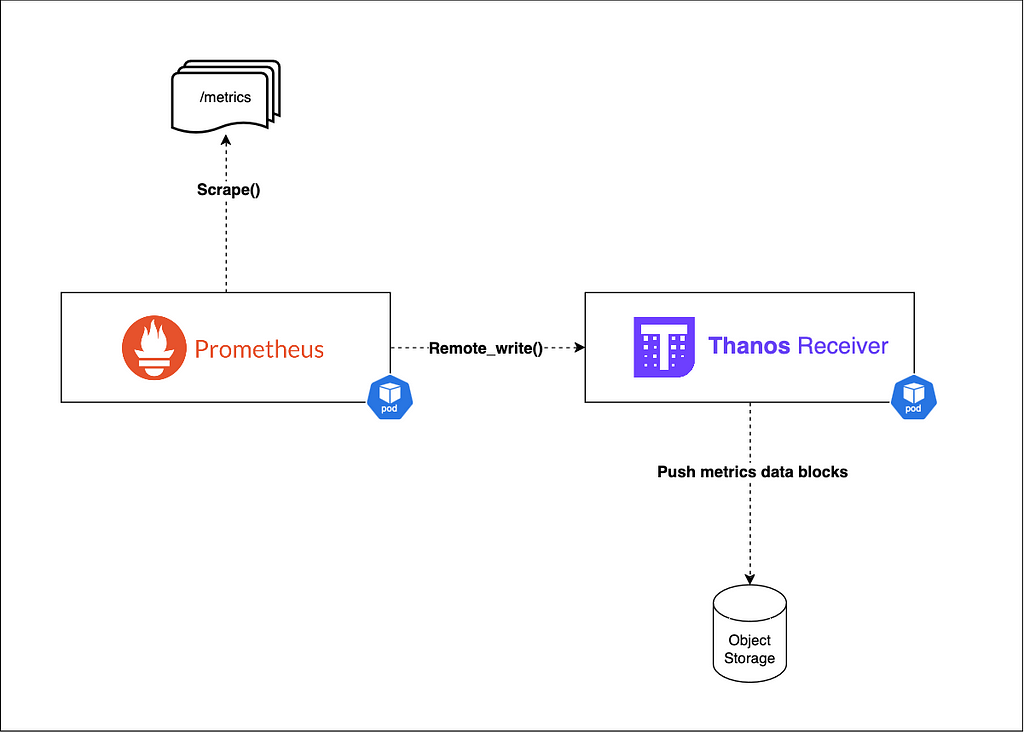
Role :
Ingests metrics data from remote Thanos Sidecars or Remote Prometheus instance via remote_write(), and writes it to object storage.
Key features:
- Accepts remote write from Prometheus
- Writes data to object storage
- Exposes metrics to other Thanos components or visualization tools for real-time viewing.
2.3 — The Store Gateway:
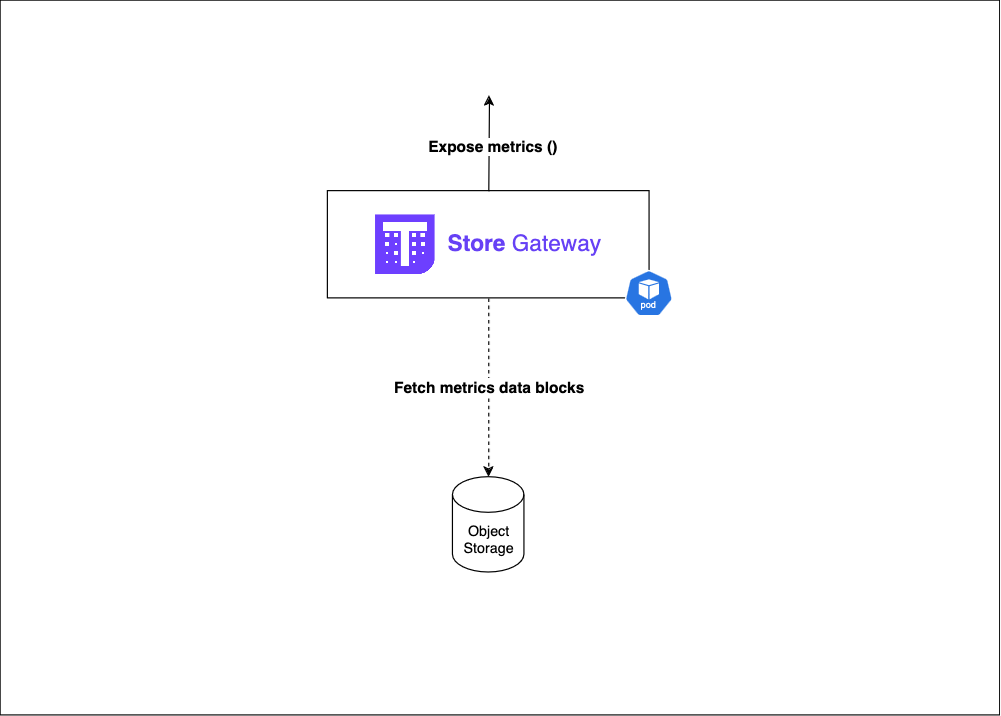
Role :
- Provides access to object storage data
Key features:
- Caches object storage data for faster access
- Optimizes data retrieval for queries
- Acts as a proxy between Querier and object storage.
2.4 — The Thanos Querier :
Role :
- Global query interface
Key features:
- Provides PromQL interface for querying
- Deduplicates metrics from different sources.
- Aggregate data from all the sources (Sidecars, Store Gatways, Prometheus,etc ).
2.5 — The Thanos Compactor:
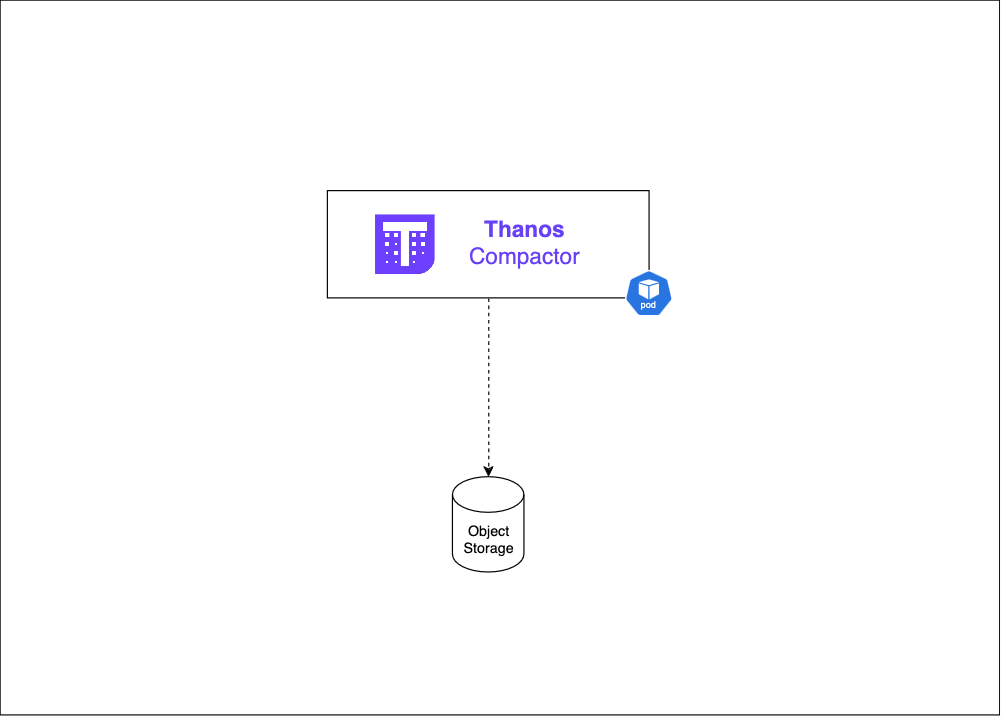
Role :
- Optimizes object storage data for long-term storage and efficient querying.
Key features:
- Data Compaction : Merges smaller blocks into larger ones, reducing storage objects and improving query performance.
- Downsampling : Creates summarized versions of historical data at lower resolutions (Typically produces 5-minute and 1-hour resolution datasets from raw data for example 60 data points per hour (raw) can become 12 points (5-min) or 1 point (1-hour) )
- Applies retention policies.
2.6 — Thanos Ruler:
Role :
- Evaluates recording and alerting rules
- Sends alerts to Alertmanager
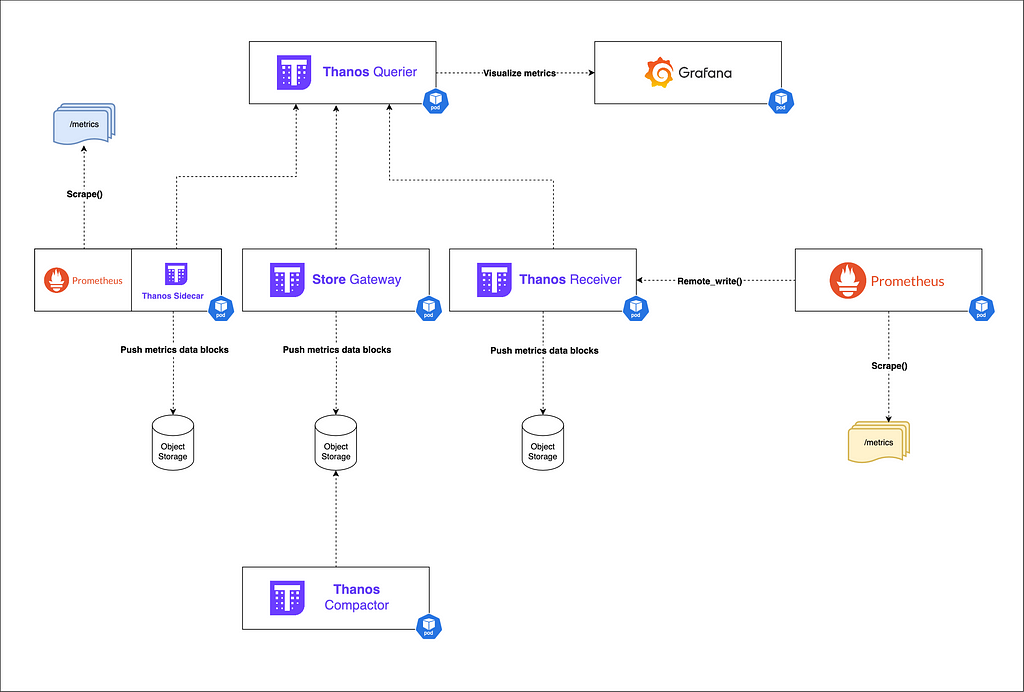
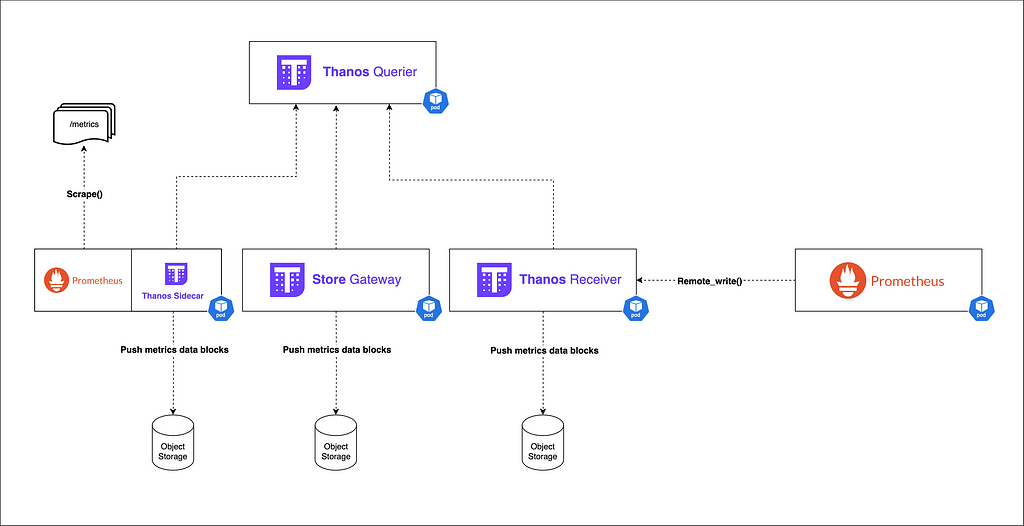
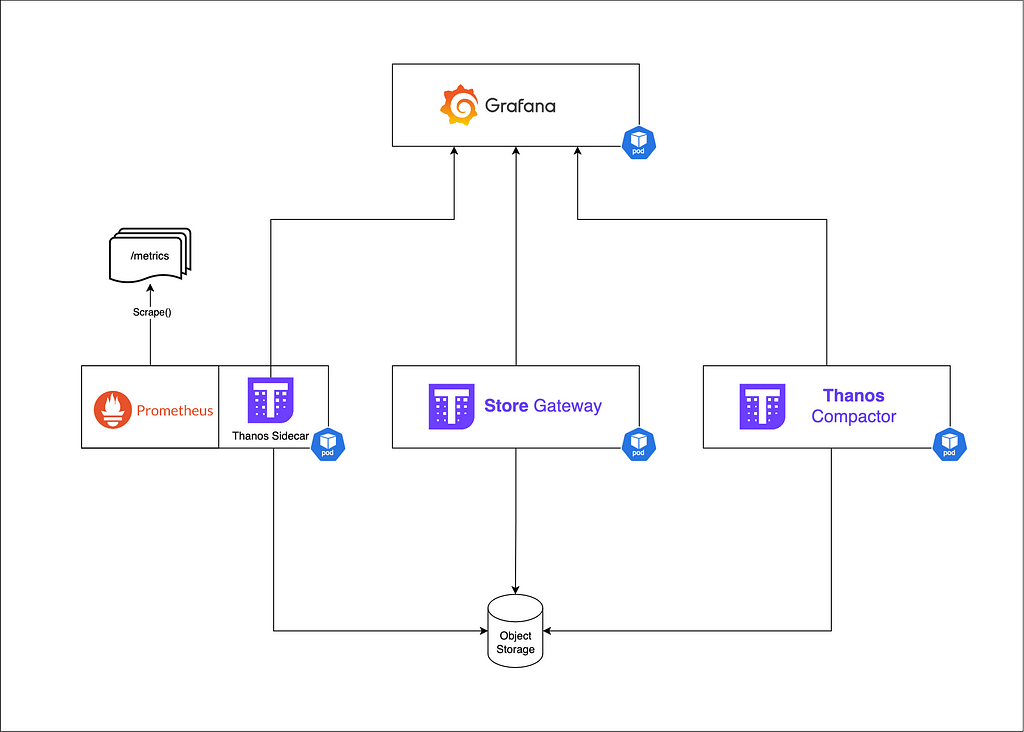
2.7 — Orchestrating all components :
 Thanos example deployment in a k8s environment
Benefits:
- Unlimited storage : By leveraging object storage, Thanos allows for virtually unlimited retention of metrics data.
- Improved query performance : Through downsampling and efficient data access patterns, Thanos maintains query performance even for long-term data.
- Native high availability : Thanos components can be scaled horizontally, eliminating single points of failure.
- Global view : The Querier component provides a unified view across multiple Prometheus instances and clusters.
3 — Thanos Example deployments
3.1 — Basic Thanos Setup
A simple Thanos deployment alongside Prometheus might look like this:
1 — Deploy Prometheus with Thanos Sidecar
2 — Set up object storage (e.g., S3, GCS)
3 — Deploy Thanos Querier
4 — (Optional) Deploy Thanos Store Gateway for historical data access.
5 — (Optional) Deploy Thanos Compactor for Optimized data storage.
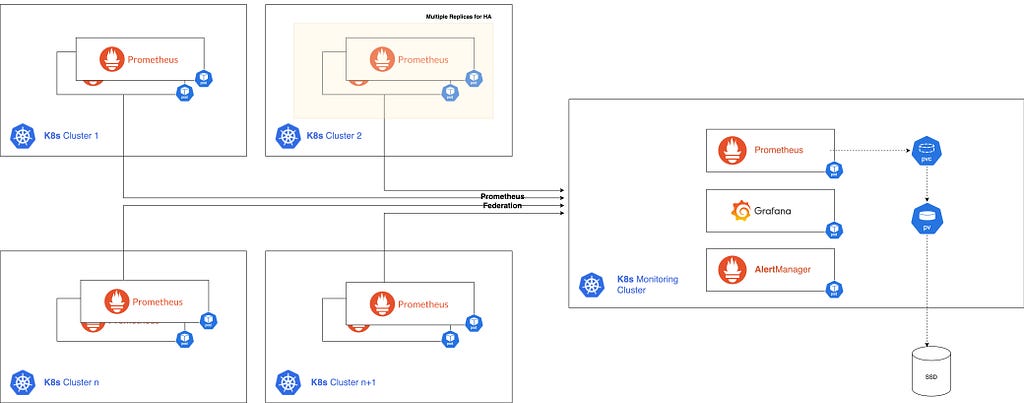
3.2 — Multiple clusters
For monitoring multiple Kubernetes clusters:
- Deploy Prometheus with Thanos Sidecar or push metrics to a Thanos Receiver instance in each cluster.
- Set up a central Thanos cluster with (Querier, Store Gateway, Compactor)
- Configure Grafana to use the central Thanos Querier as a data source
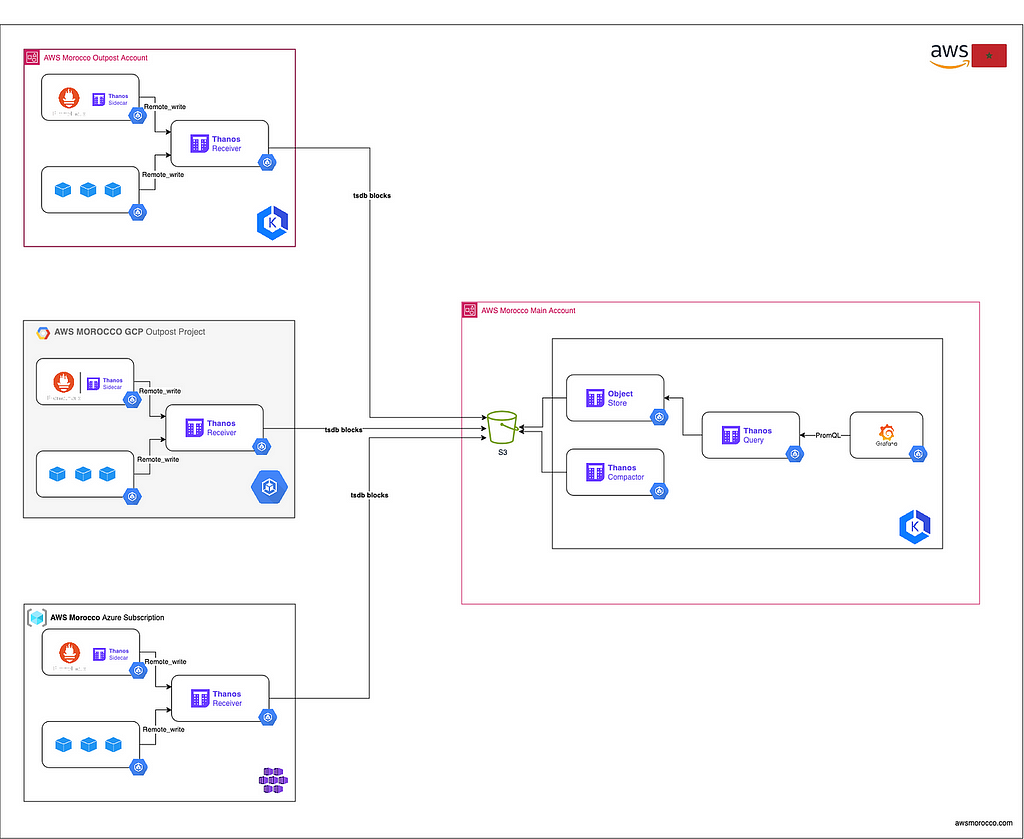
Multiple clusters indifferent cloud providers monitoring
This approach allows for a unified view across all clusters while keeping data ingestion close to the source.
Conclusion
Thanos significantly extends Prometheus capabilities, making it suitable for large-scale, multi-cluster, and global deployments. By addressing key limitations around storage, query performance, high availability, and global views, Thanos enables organizations to build robust, scalable monitoring solutions while leveraging their existing Prometheus expertise and ecosystem. As you scale your Kubernetes deployments, consider exploring Thanos to unlock the full potential of your metrics data and gain deeper insights into your distributed systems.
Bonus — Further Reading
Thanos https://thanos.io/
Thanos & prometheus at scale [PromCon 2018] https://promcon.io/2018-munich/slides/thanos-prometheus-at-scale.pdf
https://medium.com/media/5c1488e14e8fe876e45bc0efb02ec3aa/href
My talk at DEVOXX Morocco 2024 Low-Cost, Unlimited Metrics Storage with Thanos: Monitor All Your K8s Clusters Anywhere and More.
ℹ️ Architecture diagram in raw format available here: https://github.com/Z4ck404/aws-morocco-samples/blob/main/thanos-at-scale/materials/Thanos(11).drawio
Thanos Deep Dive: Addressing Prometheus Limitations at Scale was originally published in AWS Morocco on Medium, where people are continuing the conversation by highlighting and responding to this story.