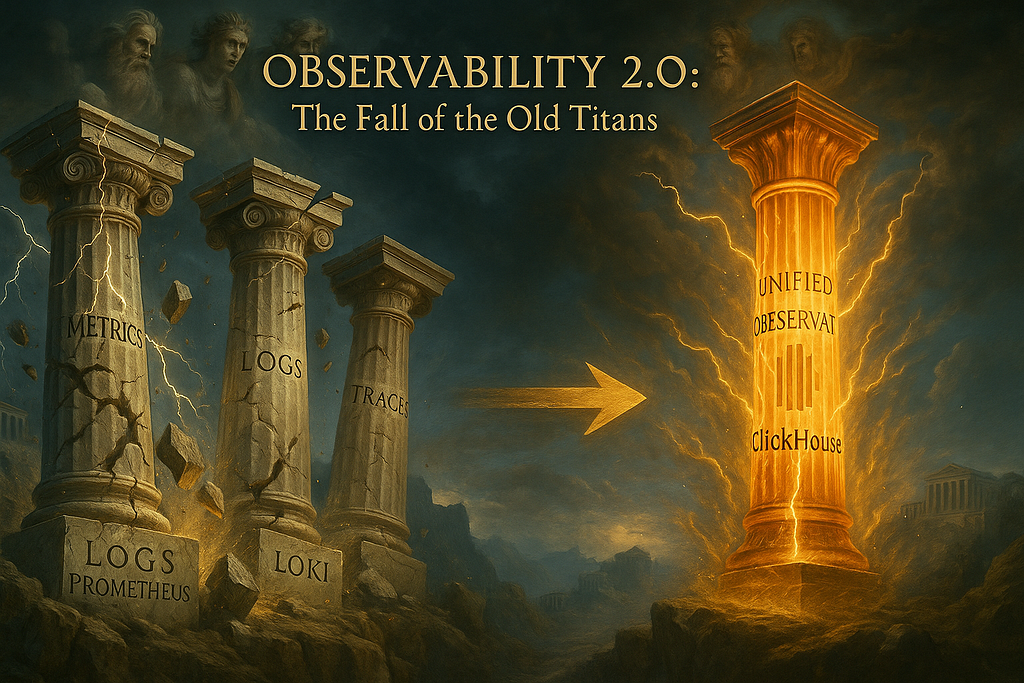
Managing observability at scale has really changed with the rise of distributed systems, and the traditional three-pillar approach (metrics, logs, traces) has become one of the biggest bottlenecks for DevOps teams. As things get more complicated, it can be difficult to keep your observability stack efficient, cost-effective and genuinely useful for troubleshooting. Just as we’ve moved from monoliths to microservices, the world of observability is undergoing its own profound transformation.
In this article, I’ll discuss the emerging “Observability 2.0” approach that is currently reshaping the way we think about monitoring and troubleshooting. I’ll explain why the traditional Metrics (Prometheus/Thanos/Mimir) + Logs (ELK/Loki) + Traces (Jaeger) stack is becoming unsustainable, introduce you to unified platforms like ClickStack and SigNoz. These new approaches can dramatically reduce observability costs, eliminate vendor lock-in and, most importantly, make debugging faster and more effective.
The Three-Pillar Problem We’re All Living With
Let me paint a picture that probably sounds familiar from my experience working with distributed systems. You’re managing a Kubernetes cluster (or several), and your observability stack looks something like this:
- Metrics : Prometheus (probably with Thanos, Mimir, or some managed service to actually make it scale)
- Logs : ELK stack or Loki with Grafana (self-hosted complexity or managed dependencies)
- Traces : Jaeger for distributed tracing (because microservices, obviously)
Everything seems fine until that dreaded 2 AM alert hits, and you realize you’re about to spend the next 30 minutes jumping between three different dashboards trying to figure out what actually broke.
Here’s the typical enterprise observability stack reality that most of us are living with:
1 — Prometheus/Thanos for Metrics
As I covered in my deep dive on Thanos, sure, Thanos and Mimir solve Prometheus’s core limitations around retention, high availability, and global querying — but now you’re essentially operating a complex distributed system just for your monitoring infrastructure. You’ve got multiple components to deploy and maintain: sidecars, queriers, store gateways, compactors, each with their own scaling and failure scenarios.
Add object storage dependencies, compaction job scheduling, downsampling rule management, and retention policy configuration, and you’ve turned your “simple” metrics collection into a full-time infrastructure operation.
The PromQL learning curve still slows down new team members, and ironically, you now have more infrastructure components that can fail precisely when you need your monitoring the most — during incidents. If you go the managed route, you’re dealing with vendor lock-in through proprietary data formats, limited control over performance tuning, and data egress costs whenever you need to integrate with other tools.
2 — ELK/Loki for Logs
ELK and Loki offer powerful search capabilities, but Elasticsearch clusters require dedicated expertise to run properly, and log volume growth means you’re constantly dealing with reindexing, shard management, and storage tiering decisions.
Index optimization becomes an ongoing operational burden, and query performance inevitably degrades as your data volume increases — just when you need fast searches the most during incidents.
The storage lifecycle management complexity grows with your retention requirements, and you’ll find yourself spending significant time tuning the system rather than actually analyzing logs.
With managed solutions, you lose visibility into the black box operations, can’t troubleshoot when the service itself is slow, face compliance challenges with data residency requirements, and end up dependent on vendor SLAs during your most critical moments.
3 — Jaeger for Traces
Jaeger is essential for microservices architectures, but you’re making sampling decisions without the context of knowing which traces you’ll actually need later.
Head-based sampling means you’re almost guaranteed to miss the exact traces you desperately need during incidents, while tail-based sampling introduces even more operational complexity and infrastructure requirements.
You’re now managing another storage backend with its own monitoring, backup, and scaling concerns, and trace correlation across service boundaries still requires manual detective work that slows down your incident response.
Managed tracing solutions limit your sampling configuration and trace retention control, create integration complexity when trying to correlate with other observability vendors, often use vendor-specific trace formats that don’t play well together, and force you to rely on support tickets instead of direct system access when you’re troubleshooting critical issues.
4 — The real kicker?
These systems don’t naturally correlate with each other. You end up playing detective at 2 AM, manually connecting dots across Grafana, Kibana, and Jaeger interfaces while your users are experiencing downtime. Your mean time to resolution (MTTR) suffers because you’re spending more time navigating tools than actually fixing problems.
The Hidden Costs That Hit Hard

Here’s something that shocked me when I did the math for a mid-size company running ~200 services:
Traditional Observability Stack Annual Costs
- Datadog (APM + Infrastructure): ~$250 k/year
- Managed ELK Stack (logs): ~$90 k/year
- Additional tooling (Jaeger, Grafana Cloud): ~$10 k/year
- Engineering overhead (30% of 2 FTEs): ~$100 k/year
Total: ~$450 k/year
+ The hidden costs:
- Time lost switching between tools
- Training burden for multiple query languages
- Alert fatigue from uncorrelated notifications
- Slower incident resolution due to tool fragmentation
And that’s just for mid‑scale — larger enterprises often exceed $1 million/year.
Enter ClickHouse: The Game-Changer
This is where my perspective on observability completely shifted. During my research into scaling monitoring solutions, I discovered that companies like Netflix, eBay, and Cloudflare were quietly moving to ClickHouse-based unified platforms.
Why ClickHouse is winning the observability game:
- Columnar Storage : Optimized for analytical queries, not transactional workloads
- Compression Magic : 12–19x better compression than Elasticsearch
- Query Performance : 5–30x faster for time-series analytical workloads
- SQL Familiarity : No more learning PromQL, LogQL, and Jaeger Query Language
- Cost Efficiency : 10–100x cheaper storage costs compared to traditional solutions
The Wide Events Revolution: Beyond Metrics, Logs, and Traces
Here’s where my understanding of observability fundamentally changed. Instead of artificially separating our telemetry data into metrics, logs, and traces, what if we stored everything as rich, contextual events?
This “wide events” approach was pioneered by Meta’s Scuba system and is now being adopted by modern platforms. Instead of this traditional separation:
- Traditional Approach (3 separate systems):
| |
| |
| |
| |
The beauty of this approach:
✅ Natural Correlation : All related data in single records
✅ Flexible Analysis : Slice and dice along any dimension
✅ Business Context : Application and operational data together
✅ AI-Ready : Single data model perfect for your AI projects
The Platforms Changing the Game
1 — ClickStack: The Fresh Approach
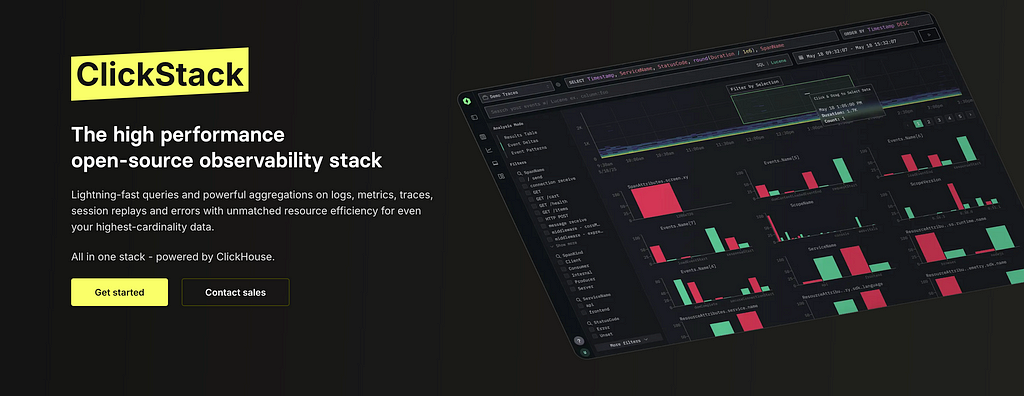
ClickStack was announced very recently in 2025 after ClickHouse acquired HyperDX, and it’s positioning itself as the complete observability stack built on ClickHouse.
ClickStack Architecture
- Data Ingestion: OpenTelemetry native (OTLP over gRPC/HTTP)
- Storage Engine : ClickHouse with optimized schemas
- Query Interface : Natural language + SQL + Lucene-style search
- UI/UX : Session replay + distributed tracing + metrics/logs
- Deployment : Single binary + Docker containers
Key Features:
- Out-of-the-box ready with minimal configuration
- Sub-second queries even on high-cardinality data
- Full OpenTelemetry compatibility from day one
- Open source with complete data ownership
2 — SigNoz: The Proven Alternative
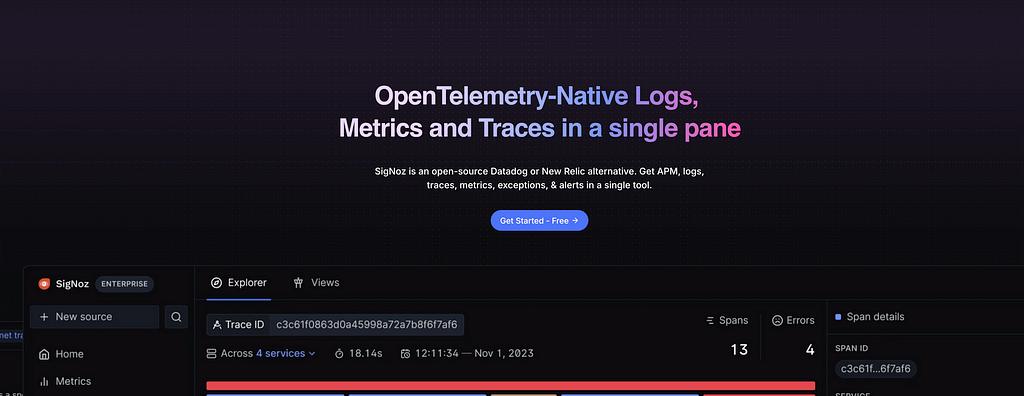
SigNoz has been pioneering the unified approach since 2021, and their journey is fascinating — they actually started with Druid but migrated to ClickHouse due to operational complexity.
SigNoz Architecture:
- Collection : OpenTelemetry Collector
- Storage : ClickHouse cluster
- Query Engine : ClickHouse SQL + custom APIs
- Frontend : React-based unified dashboard
- Deployment : Docker Compose or Kubernetes
What makes SigNoz special:
- Unified metrics, logs, and traces in single interface
- High cardinality support without traditional TSDB limitations
- Built-in alerting with webhook integrations
- SQL-powered analytics for deep investigations
- Significantly cheaper than proprietary alternatives
OpenTelemetry: The Universal Foundation
Here’s what makes this transformation possible:
OpenTelemetry has become the cornerstone of modern observability.
OpenTelemetry provides the standardized, vendor-neutral way to collect telemetry data that these unified platforms depend on.
Why OpenTelemetry is crucial:
- Vendor Neutrality : No lock-in to specific observability vendors
- Unified Standards : Single approach for all telemetry types
- Future-Proof : Built for the next generation of observability platforms
- Industry Adoption : Native support across all major platforms
The beautiful thing is that you can start instrumenting with OpenTelemetry today, even if you’re still using traditional tools. When you’re ready to migrate to unified platforms, your instrumentation investment carries forward seamlessly.
Conclusion
The observability space is at an inflection point. The three-pillar approach that dominated the 2010s is giving way to unified, analytic database-driven platforms that offer better performance, lower costs and superior debugging capabilities.
The new tools are mature, cost savings are proven and the developer experience is much improved. If you’re passionate about optimizing your observability stack and want to get ahead of the curve, I encourage you to start experimenting with these unified platforms. The investment in learning you make today will pay off as the industry continues to transform.
Observability 2.0: Breaking the Three-Pillar Silos for Good was originally published in AWS Morocco on Medium, where people are continuing the conversation by highlighting and responding to this story.