Monitoring large-scale, multi-cloud Kubernetes environments can be a hard task, especially when dealing with high-cardinality metrics and long-term data retention requirements. Traditional monitoring solutions often struggle to handle the sheer volume and complexity of metrics generated by distributed clusters across multiple cloud providers. This is where Thanos (Contrary to Marvel Thanos, this Thanos is an avenger) comes into play, providing a powerful and cost-effective solution for unlimited metrics storage and querying.
Thanos is a highly available metric system designed to be layered on top of Prometheus, the popular open-source monitoring and alerting toolkit. It allows you to seamlessly monitor all your Kubernetes clusters, regardless of their cloud or on-premises location, by aggregating and storing metrics data in a centralized, scalable, and cost-effective manner.
The Challenge of Kubernetes Monitoring
Kubernetes has become the de facto standard for containerized application deployment and management, enabling organizations to scale their applications across multiple clusters and clouds. However, monitoring these distributed environments presents significant challenges:
- High cardinality of metrics : Kubernetes generates a vast number of metrics with high cardinality due to the dynamic nature of containers and services.
- Long-term data retention : Many organizations require long-term retention of metrics data for historical analysis, capacity planning, and compliance purposes.
- Multi-cluster and multi-cloud environments : As organizations adopt a multi-cloud strategy, monitoring data must be collected, stored, and queried across multiple clusters and cloud providers.
Thanos Architecture
 [Thanos
architecture](https://thanos.io/v0.6/thanos/getting-started.md/#architecture-
overview)
[Thanos
architecture](https://thanos.io/v0.6/thanos/getting-started.md/#architecture-
overview)
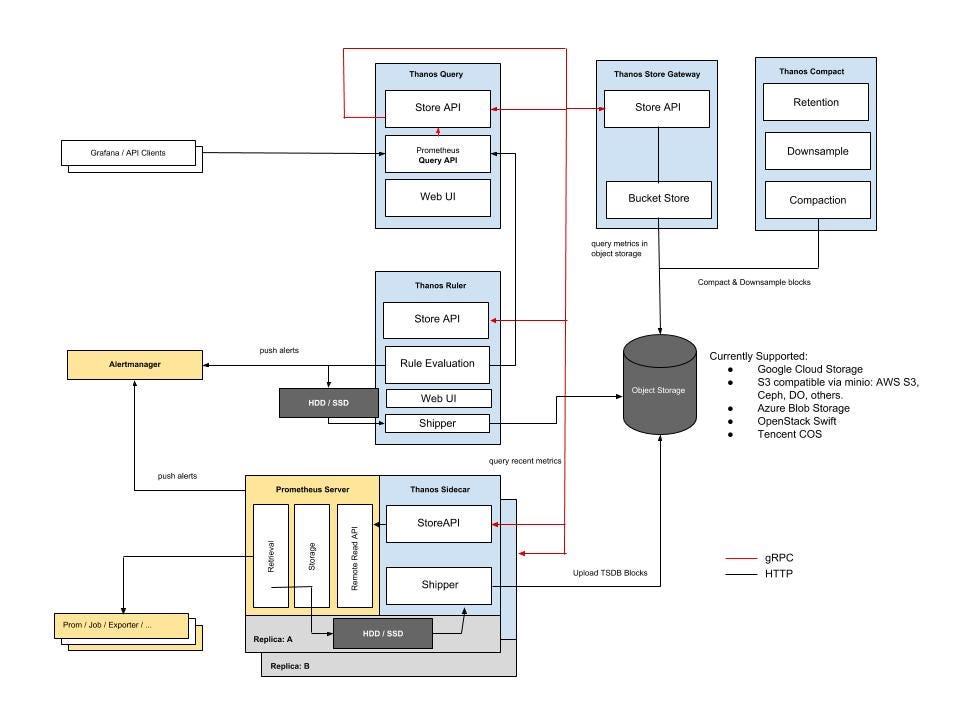
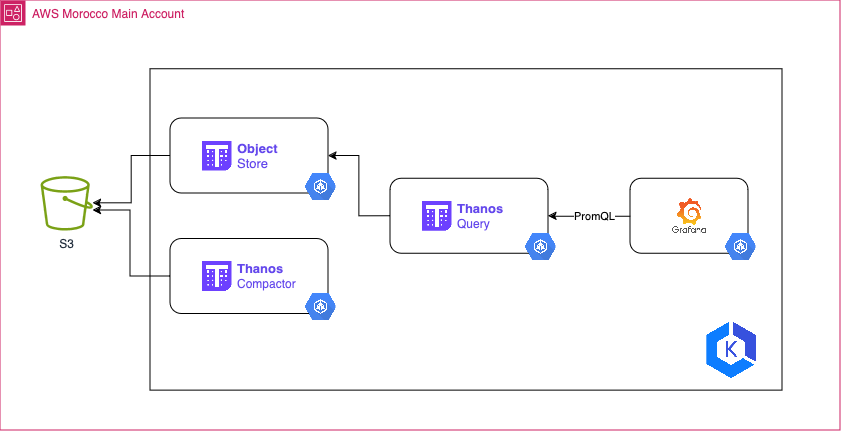
Thanos is designed to provide a highly available and scalable metrics storage solution on top of Prometheus. It consists of several components that work together to ensure reliable and efficient metrics storage and querying:
- Sidecar**** Runs alongside Prometheus instances and optionally uploads metrics data (TSDB blocks) to cloud object storage (e.g., AWS S3, GCP Cloud Storage). This allows Prometheus to be run with relatively low retention while the historic data is made durable and queryable via Thanos object storage API.
- Receiver : Ingests metrics data from remote Sidecars or from Prometheus itself when configured (Prometheus remote_write) and writes it to object storage. It also exposes these metrics to Thanos Queriers to make them available in real time to view and Analyze in Grafana for example.
- Compactor : Periodically compacts and downsamples the data in object storage for efficient long-term storage.
- Query : Retrieves and queries metrics data from object storage, enabling global querying across all clusters and cloud providers using PromQL.
Setting up Thanos for Multi-Cloud K8s Monitoring
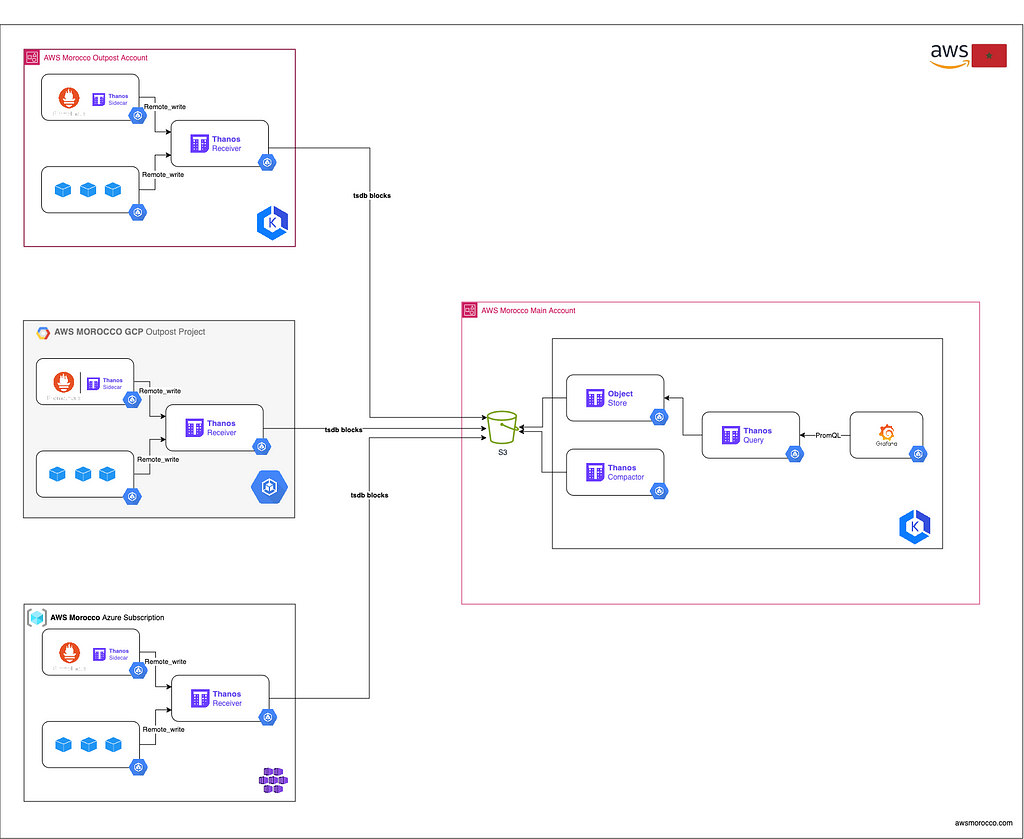
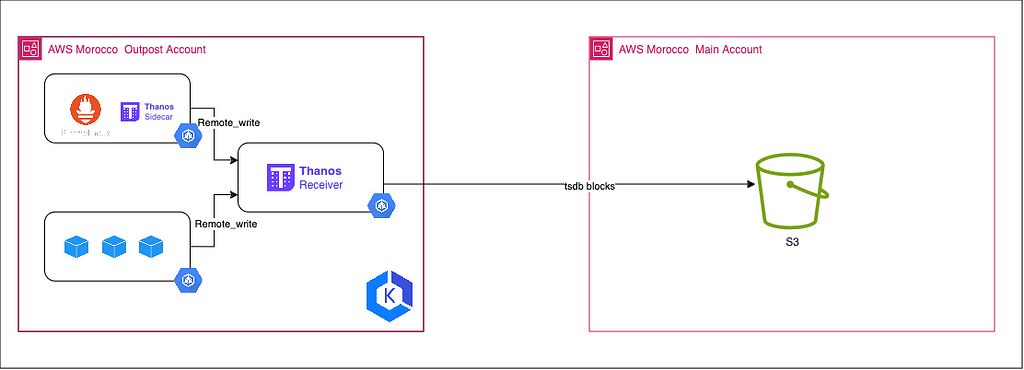
ℹ️ In this setup, we will be using a Prometheus instance running in agent mode within each cluster. These Prometheus agents will scrape metrics from their respective clusters and send the scraped data to a Thanos Receiver instance. The choice to use Thanos Receiver is based on the constraint that these clusters should be air- gapped (isolated from external networks).
1 — [OutPost Cluster] Configure Prometheus:
To enable Prometheus to scrape and forward metrics to Thanos, you need to configure it [optionally] in ‘agent’ mode by setting the –enable- feature=agent flag and defining a remote_write section in the Prometheus configuration file (prometheus.yml). The remote_write section specifies the URL of the Thanos Receiver service, where Prometheus will send the scraped metrics data.
For example, the following configuration sets up Prometheus to scrape metrics from a ‘pod-metrics’ service and remote-write the data to a Thanos Receiver:
| |
With this configuration, Prometheus acts as a light-weight agent, retrieving metrics from local targets and forwarding them to the Thanos receiver, which then writes the data to a centralised object store. Using Prometheus in agent mode reduces the resource load on individual clusters, as Thanos manages the storage, compaction and querying of aggregated metric data. This configuration allows Thanos to aggregate and store metrics from multiple Kubernetes clusters and cloud environments, facilitating global querying and analysis using tools such as Grafana.
| |
2– [OutPost Cluster] Configure Thanos Receiver:
The Thanos Receiver component is responsible for ingesting metrics data from Prometheus instances running in agent mode. It is typically deployed as a StatefulSet, which ensures high availability and persistent storage for the received metrics data.
The arguments for the Thanos Receiver container, including the object storage configuration (–objstore.config), the path for storing received data (–tsdb.path), labels to add to the metrics (–label), and various network- related settings (–grpc-address, –http-address, –remote-write.address).
| |
Notably, the –tsdb.retention argument sets the retention period for the received metrics data to 1 day, while the –tsdb.min-block-duration and –tsdb.max-block-duration arguments override the default block duration settings. By default, Thanos creates TSDB blocks every 2 hours, but this configuration sets the minimum and maximum block duration to 5 minutes (–tsdb.min-block-duration=5m and –tsdb.max-block-duration=5m).
Setting a shorter block duration can be beneficial for reducing the time it takes for metrics to become queryable in Thanos. However, it’s important to note that shorter block durations can lead to increased overhead and potentially higher storage costs, as more TSDB blocks will be created and stored in the object storage. It’s recommended to carefully consider the trade-offs between query latency and storage costs when adjusting these settings.
3– [Main Cluster] Configure Thanos Object Store:
The Thanos Store(also known as the Store Gateway) component exposes historical data stored in an object storage (TSDB blocks pushed by Thanos Sidecar or Thanos Receiver) and makes it available for querying by the Thanos Querier.
The configuration for the Store (Gateway) is typically defined in a StatefulSet or Deployment manifest. Here’s an example command with the relevant arguments:
kube-thanos/manifests/thanos-store-statefulSet.yaml at main · thanos-io/kube- thanos
--objstore.config=$(OBJSTORE_CONFIG): Specify the object storage configuration, typically provided via an environment variable or ConfigMap (See example above).
4 — [Main Cluster] Configure Thanos Query:
The Thanos Querier is responsible for retrieving and querying metrics data from object storage through the Store Gateway, enabling global querying across multiple clusters and cloud environments using PromQL (Prometheus Query Language).
The configuration for the Thanos Querier is typically defined in a Deployment manifest. Here’s an example command with the relevant arguments:
kube-thanos/manifests/thanos-query-deployment.yaml at main · thanos-io/kube- thanos
- --endpoint=dnssrv+_grpc._tcp.thanos-store.thanos.svc.cluster.local:10901 : Specify the endpoint for discovering Thanos Store services using DNS service discovery (dnssrv). This allows the Querier to locate the Thanos Store services dynamically within the Kubernetes cluster.
- --query.auto-downsampling: This enables automatic downsampling for queries. Downsampling reduces the data resolution for processing larger datasets, improving query performance.
The Thanos Querier acts as a querier, fetching data from the Thanos Store. It provides a single entry point for querying metrics data across multiple clusters and cloud environments, leveraging the storage and ingestion capabilities of the other Thanos components.
[Main Cluster] Query and view
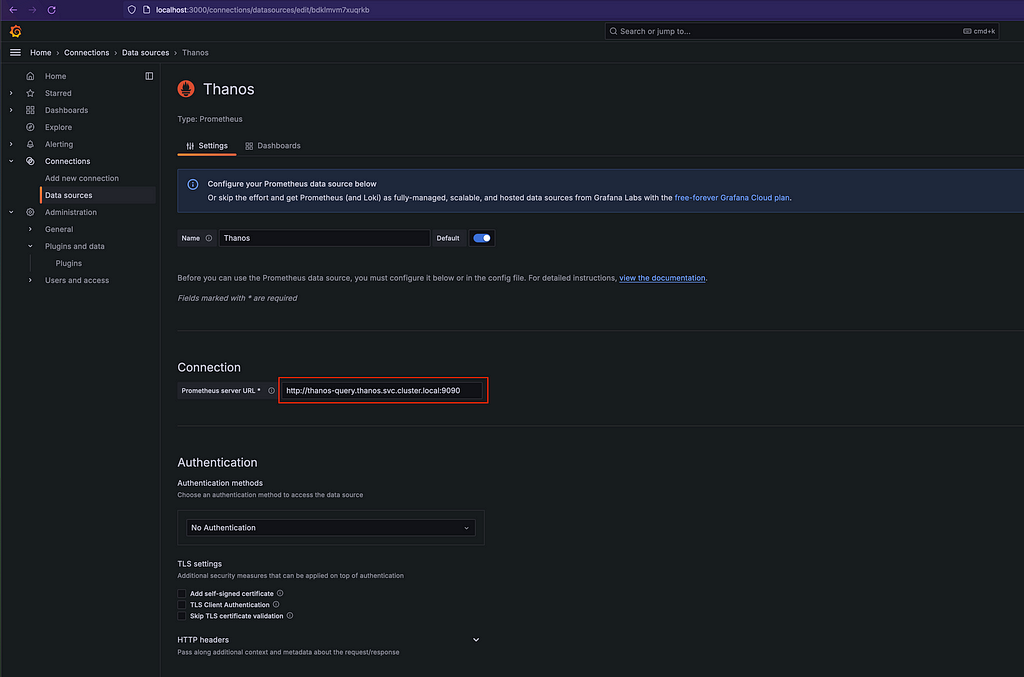
Once Thanos is configured, you can query and visualise metrics from all your Kubernetes clusters using the Thanos Query component. Thanos Query exposes a Prometheus-compatible API, so you can seamlessly integrate it with various monitoring and visualisation tools, such as Grafana. With Grafana, you can create comprehensive dashboards that display metrics from multiple clusters and cloud providers, allowing you to monitor and analyse your entire Kubernetes infrastructure in one place
Conclusion
Monitoring multi-cloud Kubernetes environments at scale is a complex challenge that requires a robust and scalable solution. Thanos, in combination with Prometheus, provides an efficient and cost-effective approach to storing and querying metrics data across multiple clusters and cloud providers.
By leveraging cloud object storage and a distributed architecture, Thanos offers virtually unlimited metrics storage capacity, high availability and long-term data retention capabilities. Its integration with popular visualisation tools like Grafana allows you to create comprehensive dashboards that provide a unified view of your entire Kubernetes infrastructure.
If you’re facing the challenges of monitoring high cardinality metrics and managing long-term data retention in a multi-cloud Kubernetes environment, Thanos is definitely worth exploring. Its powerful features and cost- effectiveness make it a powerful choice for those looking to optimise their monitoring infrastructure and gain greater visibility into their distributed applications.
ℹ️ Architecture diagram in raw format available here https://github.com/Z4ck404/aws-morocco-samples/tree/main/multi-k8s-monitoring-with-thanos/materials
Low-Cost, Unlimited Metrics Storage with Thanos: Monitor All Your K8s Clusters Anywhere and More. was originally published in AWS Morocco on Medium, where people are continuing the conversation by highlighting and responding to this story.