In my previous article on Observability 2.0, I talked about how ClickStack and unified platforms solve the fragmented three-pillar problem by storing everything in ClickHouse. That’s the ideal end state — but what if you’re not ready to rip and replace your entire stack today?
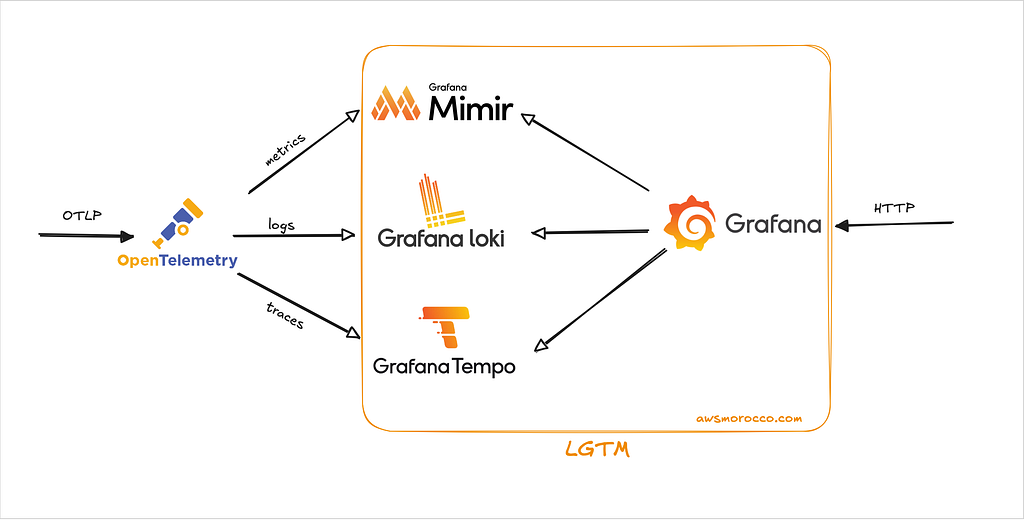
This Helm chart is the pragmatic answer. It’s still three separate backends under the hood (Loki, Tempo, Mimir), but thanks to OpenTelemetry’s OTLP protocol, it feels like one unified system. Your apps emit OTLP, hit a single gateway, and that gateway routes everything to the right storage. You get centralized ingestion, Grafana pre-wired for correlation, and zero vendor lock-in.
Think of it as the bridge between three-pillar chaos and true unified observability. When you’re ready to migrate to ClickStack, your OTLP instrumentation comes right along with you.
Why not the official Grafana charts? The upstream grafana/helm-charts repository has governance issues that create weeks-long review bottlenecks. More critically, the lgtm-distributed umbrella chart is significantly outdated—it still depends on Loki 2.9.x instead of Loki 3.x, which blocks native OTLP support. The old chart uses the deprecated loki exporter in OpenTelemetry Collector, which was removed from the official exporter list in favor of the native otlphttp exporter.
The chart can be found here: github.com/Z4ck404/otel-lgtm-charts
Let me walk you through what LGTM actually is, why OpenTelemetry changes the game, and how to get this running on your cluster.
1 — Understanding the LGTM Stack
LGTM stands for Loki (logs), Grafana (visualization), Tempo (traces), and Mimir (metrics). It’s Grafana Labs’ answer to the observability three-pillar architecture, but with a twist: every component is designed to work together natively, and they all speak the same protocols.
1.1 — Loki: Logs Without the Index Tax

If you’ve run Elasticsearch, you know the pain: massive indices, slow queries at high cardinality, and storage costs that never stop growing. Loki takes a different approach — it only indexes metadata labels, not log content. You organize logs into streams based on labels (service=payment-api, environment=prod), then grep through matching streams.
This makes Loki incredibly cheap and fast for the queries that matter during incidents. Loki 3.x adds native OTLP support via /otlp/v1/logs, TSDB schema, and structured metadata for rich context without exploding label cardinality.
The trade-off? Loki isn’t great for free-text search across years of logs. But with proper labels and structured metadata, you filter down to the exact service, pod, and request ID in seconds.
1.2 — Tempo: Distributed Tracing Without Storage Nightmares
Grafana Tempo is a high-scale distributed tracing backend designed for low-cost storage and high reliability.
Tempo does not build traditional indexes for spans. Instead, it stores raw trace data in object storage (e.g., S3, GCS, or Azure Blob) and maintains only a lightweight mapping of trace IDs to their storage blocks.
This design enables Tempo to handle petabyte-scale trace data at very low cost because it avoids maintaining large inverted indexes like Jaeger or Elasticsearch do.
Queries usually happen in two ways:
- Trace ID lookup: Sub-second retrieval when the trace ID is known (from logs or metrics correlation).
- TraceQL queries: Structured filtering and searching based on span attributes or duration, implemented via efficient block scans rather than indexes.
Tempo accepts data via OTLP gRPC/HTTP, Jaeger, Zipkin, or Tempo protocols, allowing easy integration with OpenTelemetry collectors. While configuration is straightforward, exporters still need to point to the Tempo endpoint.
1.3 — Mimir: Prometheus, But Make It Scale

If you read my previous article on Thanos, you know Prometheus’s limitation: single-node design with short retention. Thanos solves this with multiple deployment modes — sidecar pattern, Receive mode (remote write), or Ruler for recording rules. Mimir takes a different approach — it’s a distributed TSDB built from the ground up for horizontal scale.
Mimir’s architecture mirrors Loki and Tempo: ingesters, distributors, queriers, and compactors operate as independent microservices. You can scale ingestion separately from queries, run multi-tenant setups, and store years of metrics in object storage. It speaks Prometheus remote write and now supports OTLP over HTTP natively — OpenTelemetry metrics land directly without Prometheus in the middle.
The key difference? Thanos offers flexibility (sidecar for existing Prometheus, Receiver for remote write, or full replacement). Mimir is opinionated — it’s designed as a complete metrics platform from day one. If you’re starting fresh and want native OTLP support, Mimir is cleaner. If you need gradual migration or have complex Prometheus setups, Thanos gives you more paths forward.
1.4 — Grafana: The Unified Query Interface
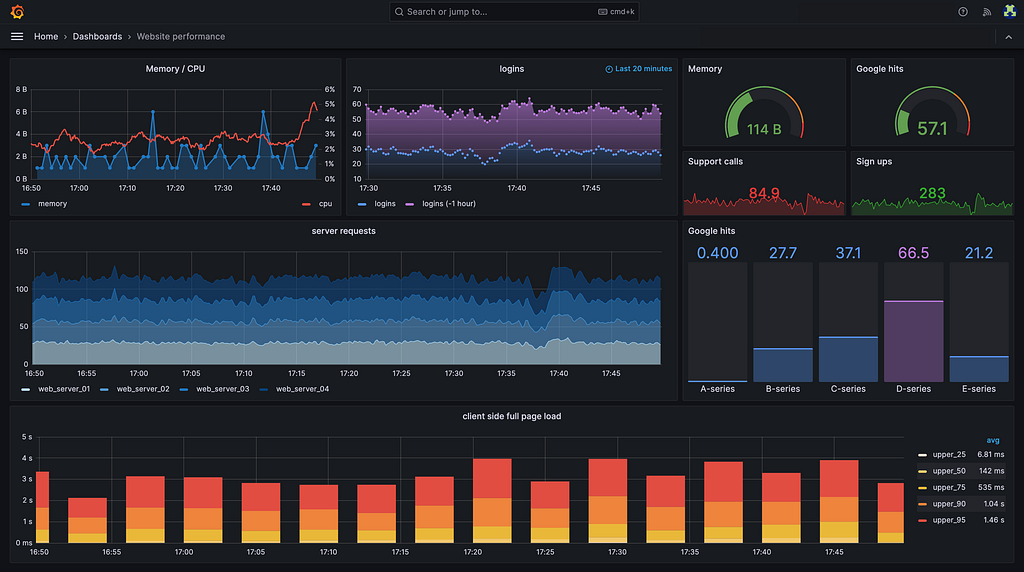
Grafana is the glue that makes LGTM feel like a single system. Instead of jumping between Kibana for logs, Jaeger UI for traces, and Prometheus for metrics, Grafana Explore lets you query all three signal types in one interface with built-in correlation.
2 — Why OpenTelemetry Changes Everything
Here’s the breakthrough: OTLP is the universal telemetry protocol. Before OpenTelemetry, instrumenting an app meant:
- Installing the Prometheus client library for metrics.
- Adding a Jaeger or Zipkin SDK for traces.
- Configuring a log shipper (Fluent Bit, Logstash, Promtail) for logs.
Each required different configuration, different exporters, and different mental models. OpenTelemetry collapses all of that into one SDK, one protocol, one collector.
Your app emits OTLP over HTTP or gRPC. The OpenTelemetry Collector receives it, applies processors (batching, sampling, enrichment), then fans out to:
- Loki’s
/otlp/v1/logsendpoint. - Tempo’s
/otlp/v1/tracesendpoint. - Mimir’s
/otlp/v1/metricsendpoint.
The chart otel-lgtm-charts layers an OTEL Gateway Deployment (for external traffic) and an OTEL DaemonSet (for node/pod metrics) on top of the LGTM components. The gateway becomes your single ingestion point for all telemetry, which means:
- ✅ You instrument once, and the collector routes to the right backends.
- ✅ You swap backends (Loki → ClickStack, Mimir → Thanos) by changing collector config, not application code.
- ✅ You avoid vendor-specific agents, exporters, and lock-in.
This is why I keep saying OTLP is the constant. Even if you migrate to ClickStack next year, your instrumentation stays identical — you just reconfigure the collector’s exporters.
3 — The Data Flow at a Glance
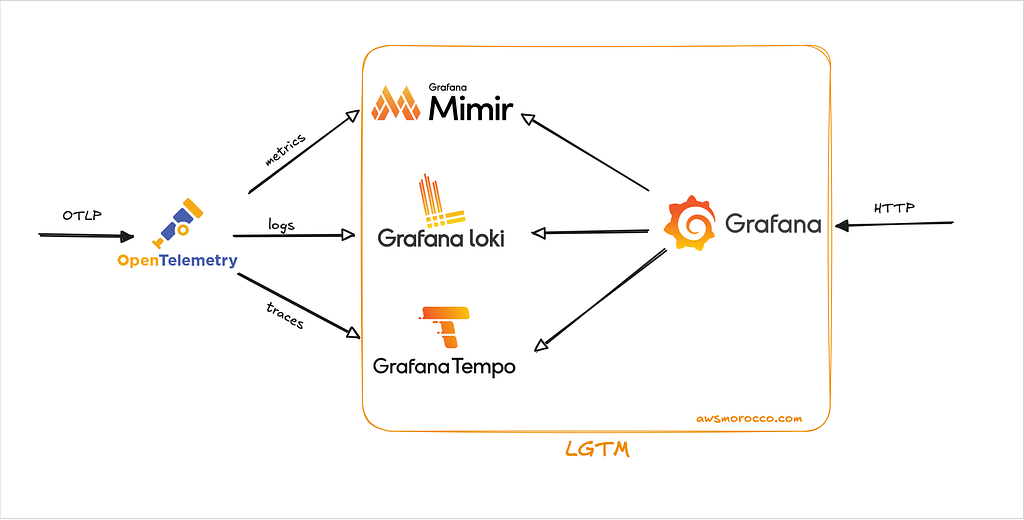
First, Apps emit OTLP (HTTP or gRPC) using the SDK or OpenTelemetry Collector Agents.
Then, An OTEL gateway Deployment receives that traffic, runs a few processors (batching, resource detection), then fans out to:
otlphttp/loki→ Loki 3.x via/otlp/v1/logsotlphttp/mimir→ Mimir over OTLP HTTPotlp/tempo→ Tempo over OTLP gRPC
Optionally, a DaemonSet collector scrapes node/pod metrics and collects container logs (great for bare-metal clusters).
Grafana comes pre-wired with the right data sources so Explore works immediately.
4 — Quick Start (Small Cluster)
The lightweight path I use for demos:
| |
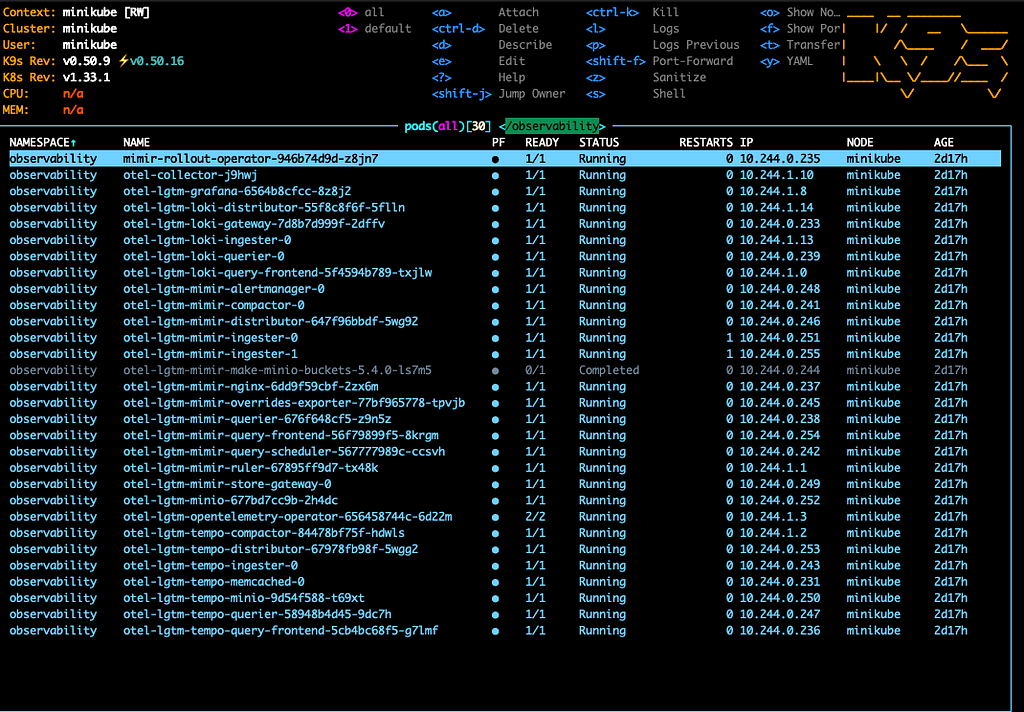
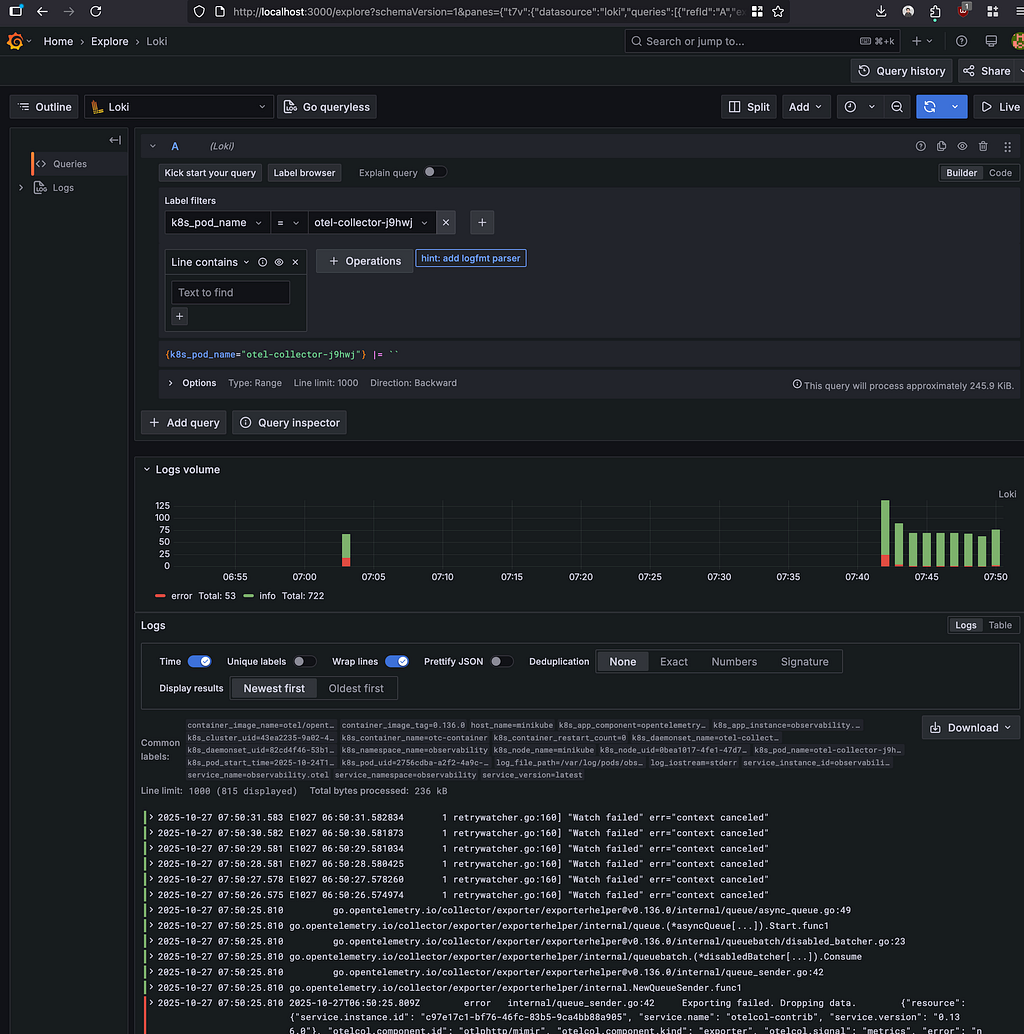
You’ll see a healthy ring when you tail the distributor logs:
| |
Grafana is a simple port-forward away (See the charts values for the default creds):
| |
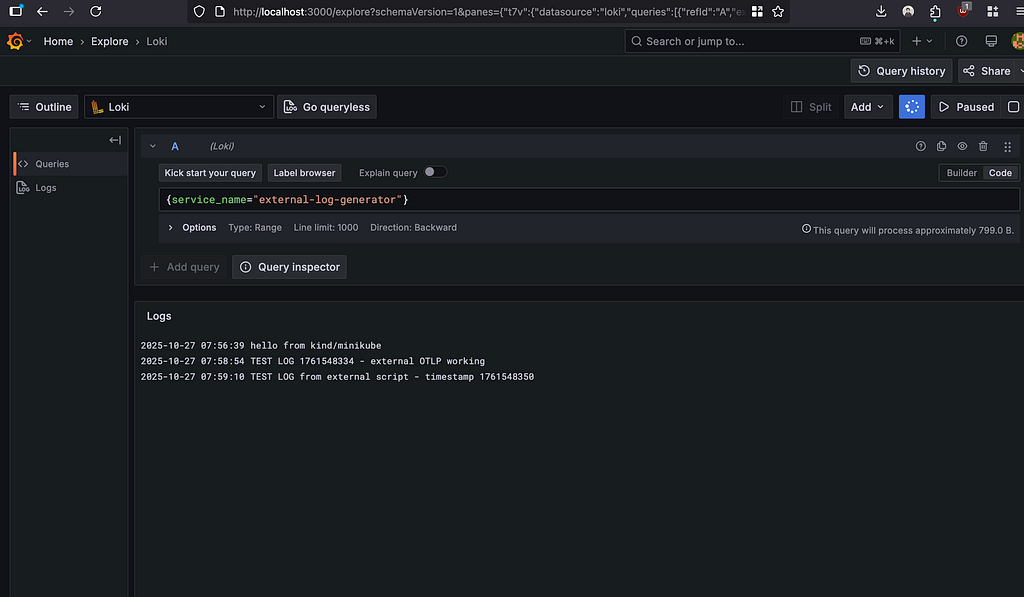
To send your first OTLP log via the exposed gateway:
| |
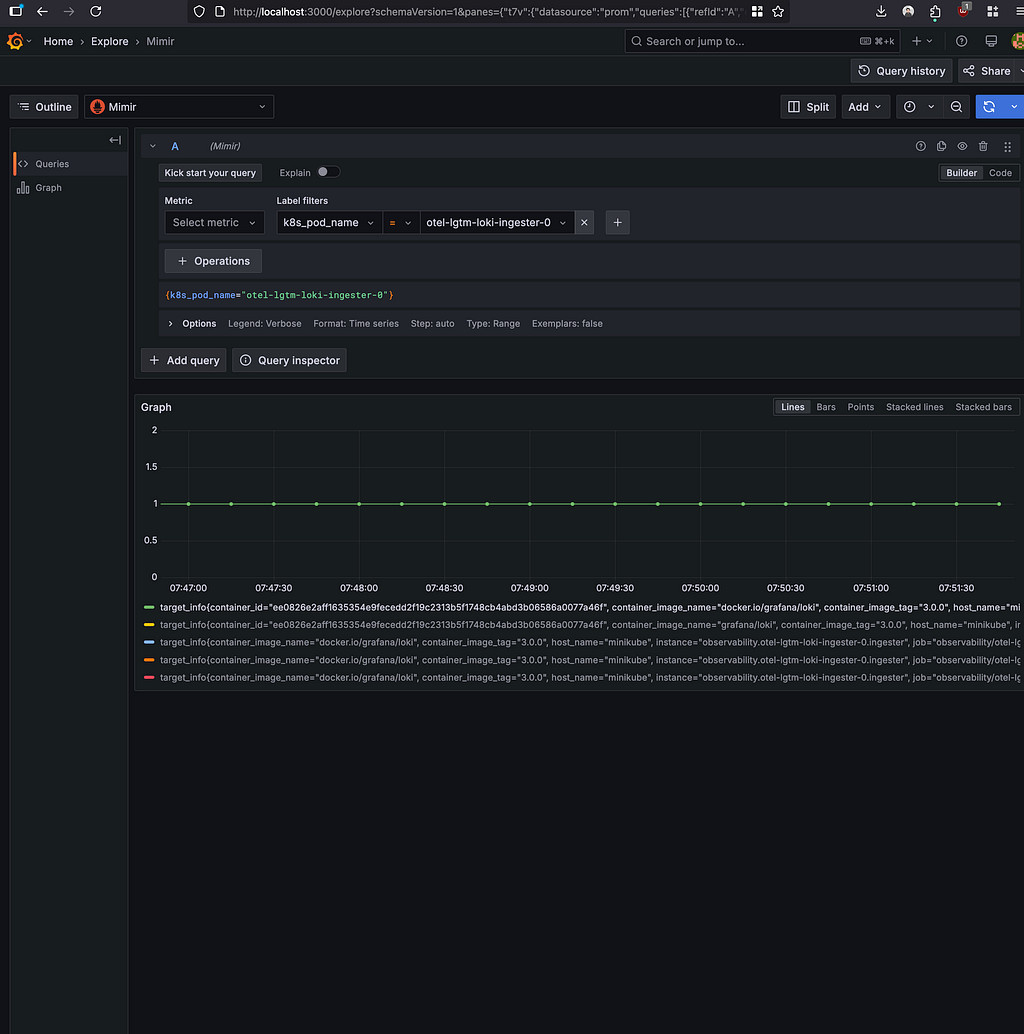
Open Grafana → Explore (Loki) and search for hello from kind/minikube.
Final Thoughts
This Helm chart is my current shortcut: an OTEL gateway, Loki/Tempo/Mimir configured for OTLP, Grafana ready to explore, and enough knobs to grow from PoC to production without rewriting the stack.
It’s not the unified ClickHouse storage I talked about in Observability 2.0 — that’s still the ideal end state. But it’s the pragmatic path to get OpenTelemetry instrumentation right now, with a clear migration path when you’re ready for true unified observability.
Grab the repo, run the minimal install, toss a few logs through the gateway, and watch the signal light up Grafana. When you’re ready to scale it, the chart has all the needed settings for persistence, security, and high availability — check docs/README.md for the full production hardening guide (Let me know if anything is missing or not working as expected 🙏)